Research Projects
Bamberg Data Stories (Smart City Bamberg)

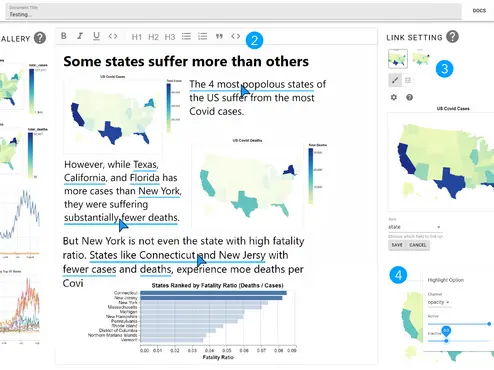
Localized and Personalized Visual Storytelling for Public Geodata Comparing Different Modes of Presentation
Funded by: Smart City Bamberg as part of the Smart City Research Lab
Funding period: 2023–2026
CoCo (DFG)

Comparative and Collaborative Visual Analysis of Clustering and Co-clustering Ensembles
Funded by: Deutsche Forschungsgemeinschaft (DFG) in collaboration with Fonds National de la Recherche (FNR, Luxemburg)
Funding period: 2023–2026
vgiReports (DFG)

Accessible Reporting of Spatiotemporal Geographic Information Leveraging Generated Text and Visualization
Funded by: Deutsche Forschungsgemeinschaft (DFG) within Priority Programme 1894 "Volunteered Geographic Information"
Funding period: 2019–2024
Previous Projects
- vgiReports: Accessible Reporting of Spatiotemporal Geographic Information Leveraging Generated Text and Visualization; DFG, 2019-2024
- Comparative Analysis of Dynamic Networks Combining Statistical and Visual Methods; MERCUR, 2020-2023
- SoftwareDynamics²: Fine-Grained Evolution of Software Behavior; DFG, 2017-2022
- Vis-Text Interaction: Interactive Links of Information Visualizations and Texts; Baden-Württemberg Stiftung, 2015-2019
Research Areas and Selected Contributions

Talk: Understanding Complex Behavior

ICG Lab Talk Series, Fabian Beck and Shivam Agarwal, University of Linz, April 26, 2023
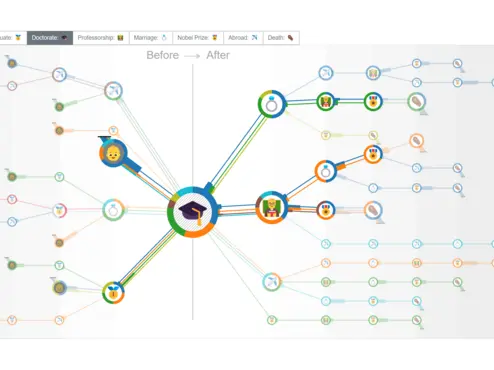
Visualization Technique: Double Trees
State-of-the-art Report: Dynamic Graph Visualization
A systematic overview of approaches for dynamic graph visualization
⭐ Highly cited
Comparing Hotel Reviews: ViSCitR

Talk: Aus Daten werden interaktive Geschichten (de)
Smart City Lecture Series, Fabian Beck, University of Bamberg, Feb. 8, 2024
Video (de)
Concept: Talking Realities

Talk: Selbsterklärende visuelle Datenrepräsentationen (de)
Inaugural lecture, Fabian Beck, University of Bamberg, June 16, 2022
Video (de)
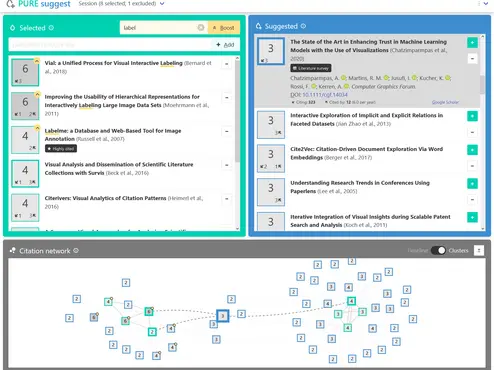
Tool: PURE suggest
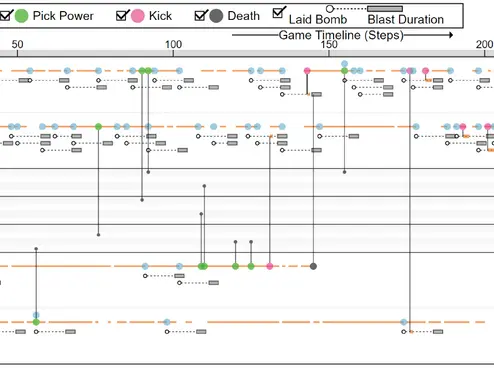
Application Study: Bombalytics
Application Study: Performance Evolution Matrix
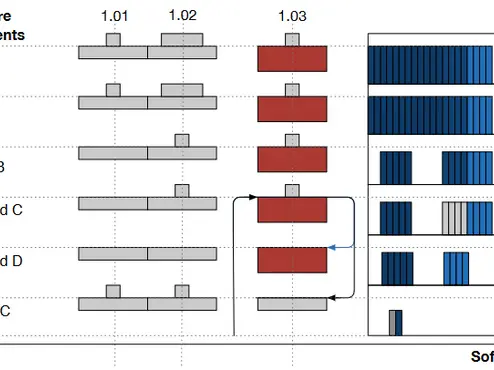
Visually investigating regressions in the evolving performance of software systems
⭐ VISSOFT 2019 Best Paper