Statistical analysis nowadays is an indispensable method for linguists in order to understand the quantitative relations of their data. This companion website deals with R, an open source implementation of the statistical programming language S, which is one of the top computational statistics programming environments. It can be downloaded from the Comprehensive R Archive Network (CRAN) at http://cran.r-project.org/.
I admit that at first it might be more difficult to work with R than with other programs that have been especially designed for assisting with linguistic data. This is because R as a programming language needs scripts and codes instead of just a few clicks on the right buttons. But still, it is worth investing some time and patience, since there are many good reasons to use R instead of any other program.
The first one is that the time needed in the beginning to write scripts is made up as soon you start processing and performing tasks on your data, because R surpasses its competitors in terms of processing time by far.
Second, by using a programming language, one has more control over one’s own statistical analysis. Ready-made programs with a graphical user interface might have inconvenient settings that cannot always be changed by the user. For advanced researchers in particular, an important advantage of R is that you can write your own code, which gives you the necessary freedom to explore your data in the best fitting way.
Furthermore, R is a non-profit software. It was developed under the GNU General Public License, the most widely used free, copyleft license for software. This means that revisions are not made by a company whose main goal is to obtain money, but of the software community that is interested in perfecting the system. Also, it is free of charge and any student or computer lab administrator can download the software and install it without any expensive license fees.
Another difference between R and similar programs is that with all its functions available, R is an all-in-one tool and can replace several other programs. It can be used as a calculator, an environment to statistically analyze data sets, a statistical graphics program, and a programming language all at once.
Of particular importance is the fact that it features enormous dynamic visualization capacities, which help to gain an insight into the data far more easily and quickly than by executing various tests. In this approach, called Exploratory Data Analysis (EDA), the main characteristics of a data set are visually summarized without having a hypothesis formulated in advance.
Gries’ example of the Anscombe data in Fig. 1 illustrates how indispensable a visual inspection of one’s data is, and why visual exploration should always precede statistical computation. Comparing these four distributions only by simple summary statistics, one would get the same means and variances, correlations and regression line, although analyzing the data in a graphical way one immediately can see that the four data sets vary considerably. The top left is linear but with one outlier, the top right is curvilinear, the bottom left has to correlating variables with a normal distribution, and the bottom right shows a non-linear relationship where again one outlier produces a high correlation coefficient.
The promotion of Exploratory Data Analysis inspired R with its exceptional graphical abilities. Therefore, it is especially interesting and rewarding to learn about R’s resources for graphical representation, which is why this companion website will focus on providing a short introduction to the graphical analysis of quantitative data for linguists and present a variety of functions to use in R for the visualization of data. A first chapter will deal with basic knowledge about R and the classification of variables. The next chapters will discuss methods for the graphical representation of univariate (one-dimensional), bivariate (two-dimensional), and multivariate (multi-dimensional) data. After these, I will present the selection of books dealing with R for linguists that I worked with and I will evaluate them in order to provide practical recommendations. The end will lead us back to the question if graphical analysis can stand alone or if further statistics is needed in order to fully understand one’s data.
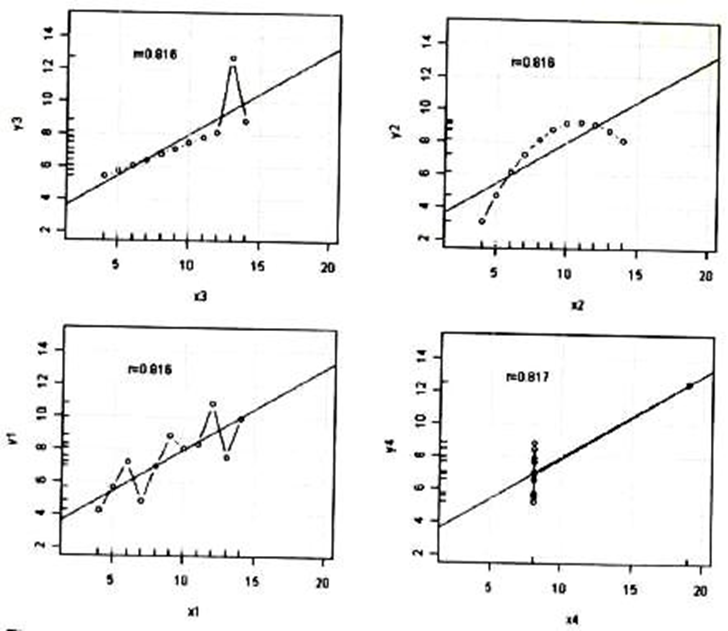
Fig. 1: The sensitivity of linear correlations: the Anscombe data (Gries 2009b: 147).
Created with the Personal Edition of HelpNDoc: Produce electronic books easily