Notes:
Pooling can only be conducted with absolute numbers.
Relative numbers, such as percentages, are not suitable.
Thus, if one computes the average of one of the first columns, the output is not an absolute number, as it should be, but, again, a relative number. In those cases, the output would be an average of averages.
Columns 6 and 7 are the only ones to contain absolute numbers and this is why they are used to show the application of pooling.
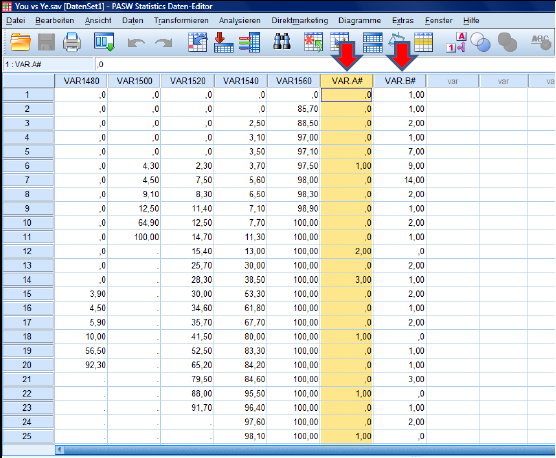
Columns 6 and 7 are the only columns under investigation.
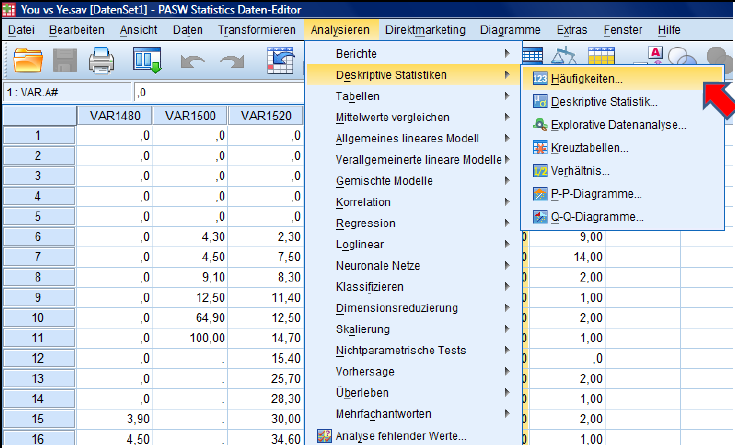
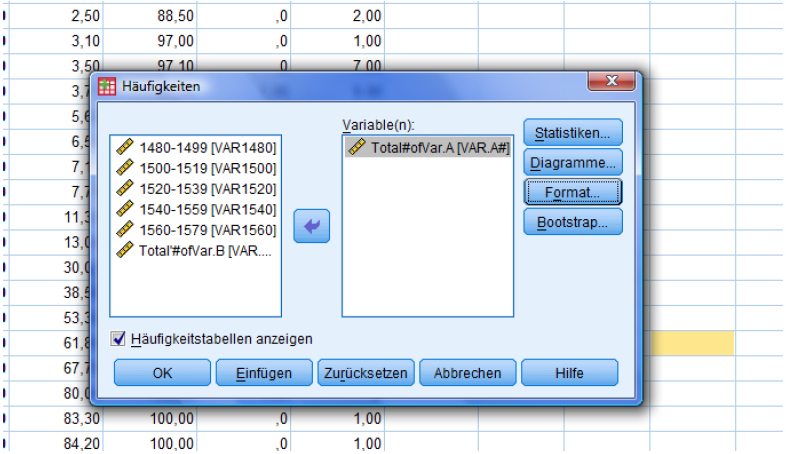
First, go to ‚Analyze‘ … ‚Descriptive Statistics‘ … ‚Frequencies‘
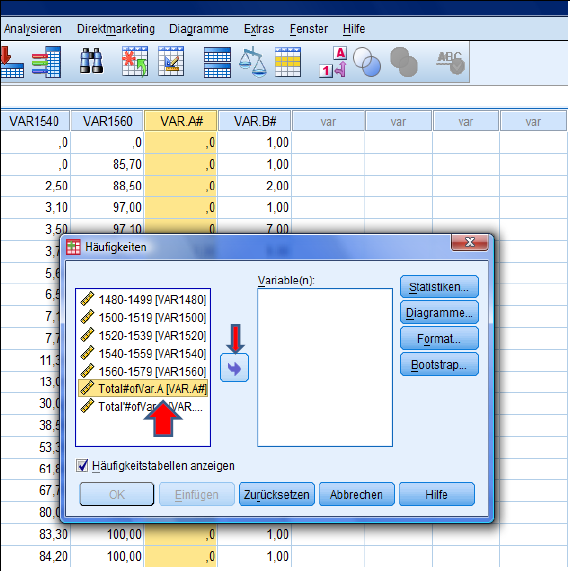
Now, activate Column 6 by marking it in the left table and then clicking on the arrow.
It should then appear in the right box (‚Variables‘).
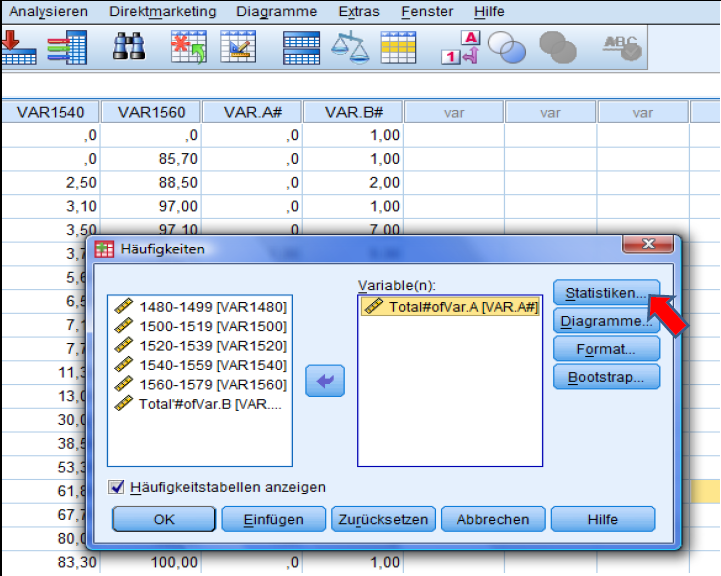
Now, click on ‚Statistics‘
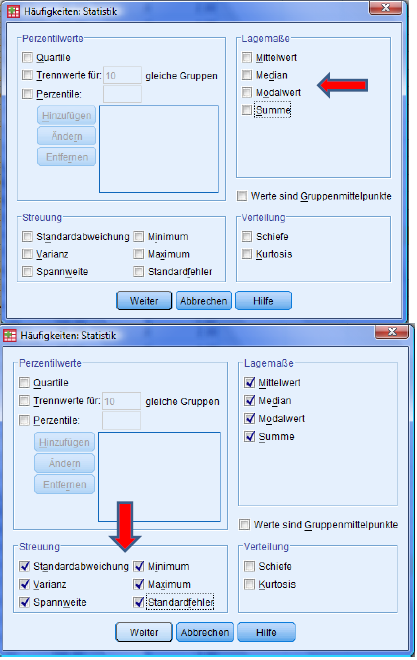
For a statistical output that can be worked with, activate Mean, Median, Mode, Sum, Standard Deviation, Variance, Range, Minimum, Maximum and Standard error. Now, click on continue.
Press OK.
A second window with your statistical output will appear
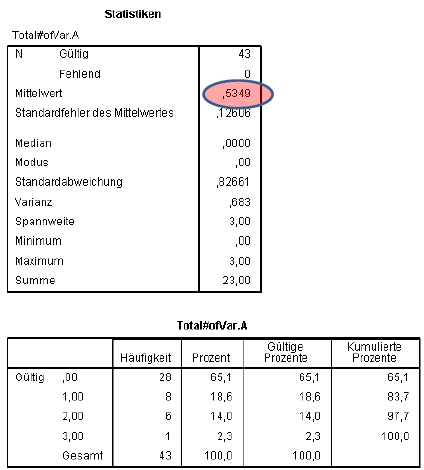
The number you are looking for is the mean. In this case it is 0.5349.
The other values are not of specific interest if you only look for the average by using ‚pooling‘. They only serve for further statistical interpretation.
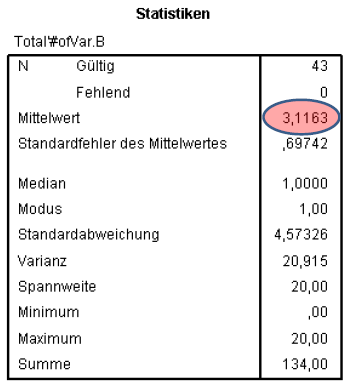
Output for Column 7 / Variable B
Comparison: MS Excel vs. SPSS
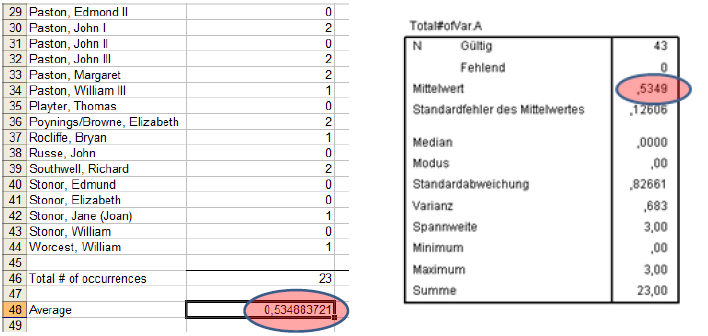
Indeed, both software programs produce the same output.
Created with the Personal Edition of HelpNDoc: Easily create Web Help sites